Discover in “Most Popular Course”
516 Results

Fundamental General Affairs
Certified Online Training for General Affairs
Category : Business Management, Team Management
Language : Bahasa Indonesia
Location Address : N/A
IDR 1,000,000

General Affairs Management
Certified Online Training for General Affairs
Category : Business Management, Procurement/Purchasing
Language : Bahasa Indonesia
Location Address : N/A
IDR 3,000,000

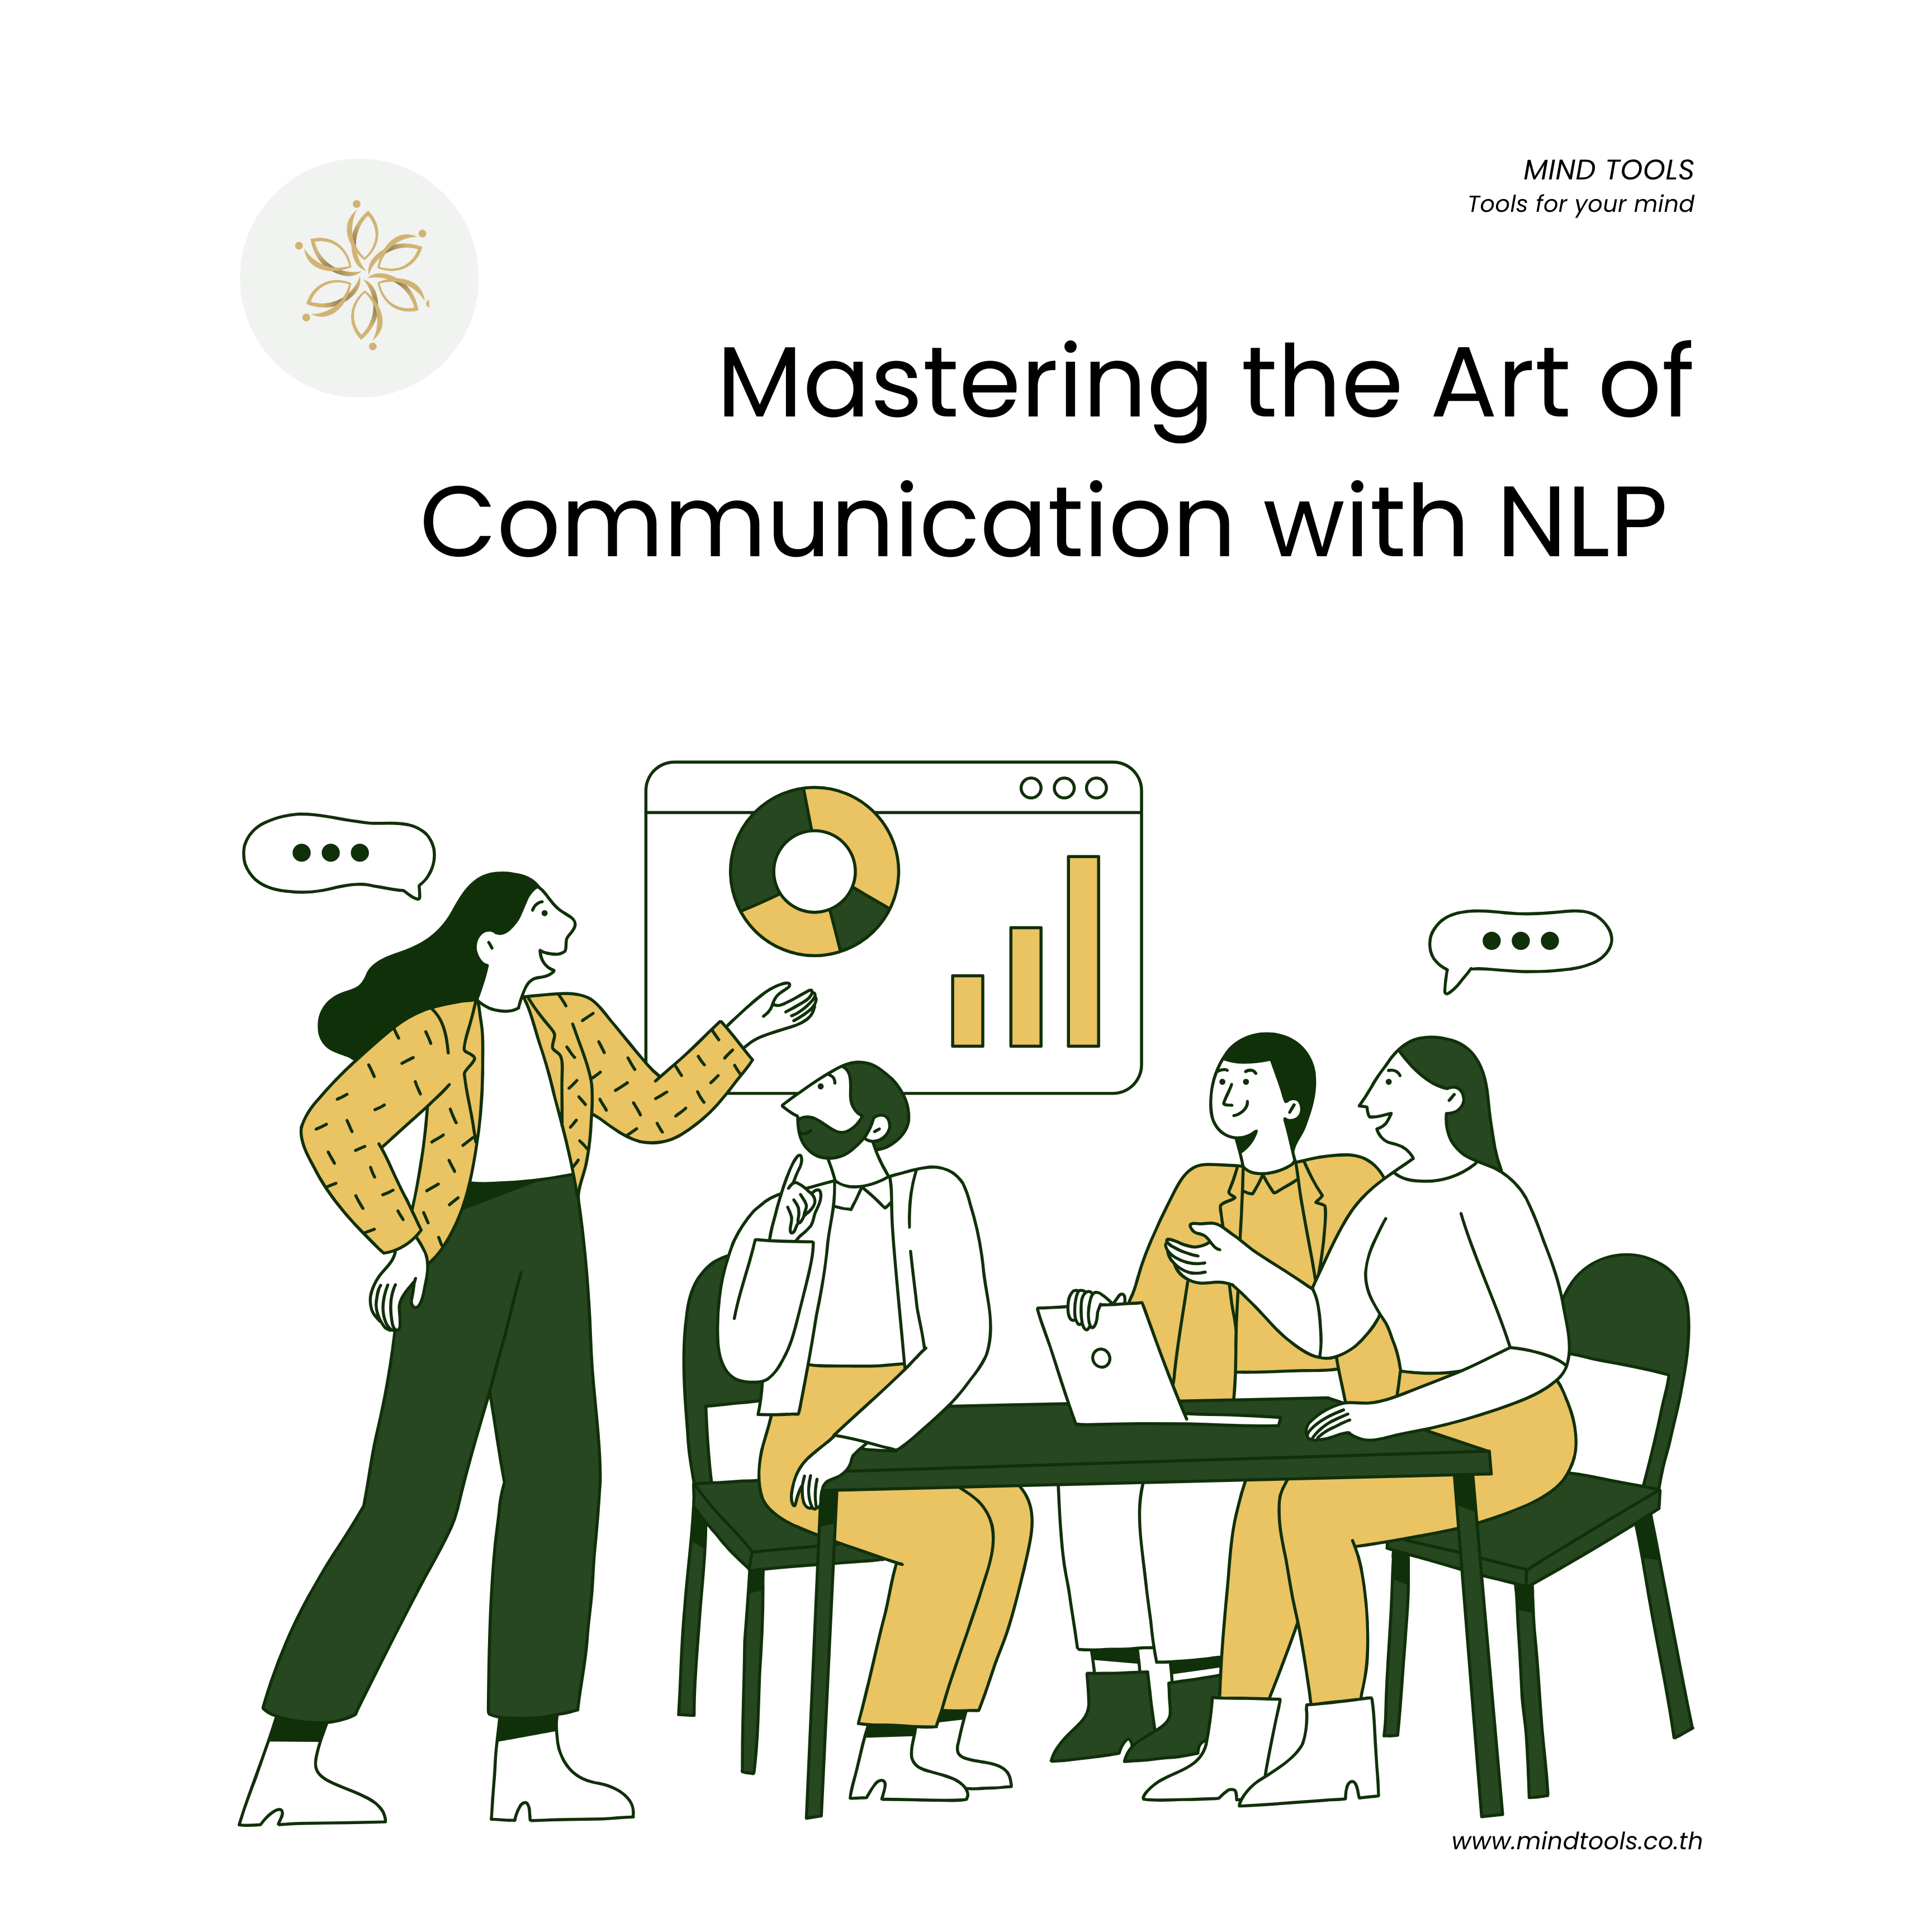
Mastering the Art of Communication with NLP 24 May 2025
นี่คือโอกาสของคุณ! ร่วมเรียนรู้ NLP (Neuro-Linguistic Programming) เทคนิคที่ช่วยพัฒนาทักษะการสื่อสาร สร้างความสัมพันธ์ที่ดี และเพิ่มพลังการโน้มน้าวในแบบฉบับของคุณเอง ทั้งในชีวิตส่วนตัวและการทำงาน!
Category : Effective Communication, Negotiation, Sales & Marketing, Team Management
Language : Thai
Location Address : Bangkok , Thailand,
THB 4,250.00 Now Only
THB 3,650

AI Course for Business - Online Training Level 1 - May 2025
Master Generative AI in 1.5 hours! Learn key principles, powerful prompts (ERCFC model), and business integration strategies to boost efficiency and innovation. Practical, insightful, and game-changin
Category : All Category
Language : English
Location Address : N/A
THB 2,750
Showing 511 to 516 of 516 entries
Showing to of entries


